
H is for histogram! This week's Photography Fundamentals installment explains the graph that you can draw up on your camera for each image, or appears in the top right corner of your workspace in Lightroom or Photoshop. What does it depict and how is it useful?
It's a graph
A histogram is a graph that shows the tonal range, or the distribution of brightness, of an image's pixels. On its X-axis it runs from black to white, 0 to 255. On its Y-axis it charts the number of pixels at any brightness value.
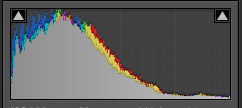
By looking at a histogram you'll have a feel for the exposure of an image. If the majority of the pixels are sitting in the left-hand side of the histogram, the image will have a lot of darker tones. An image with plenty of bright tones will have a histogram that's predominantly situated in the right-hand side.
A perfect histogram?
There's no such thing as a perfect histogram. Instead, you need to use it as a tool to help you judge if you've exposed your image how you want it exposed. Sure, if your image has a histogram that's concentrated towards the left, it might be under-exposed. It might also be a low-key image with predominantly dark tones.
However, the majority of images will have histograms that peak around the centre, in the mid-tones, but taper out towards the blacks and the whites.

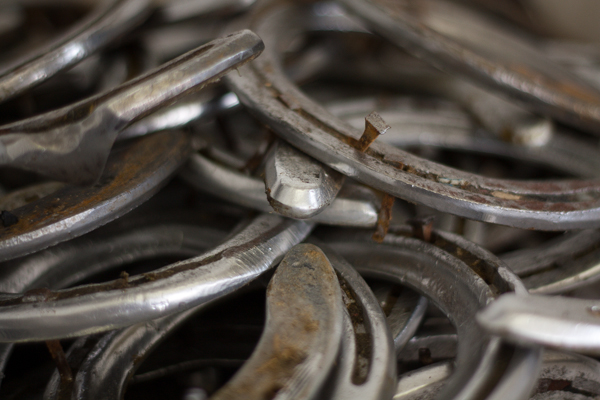
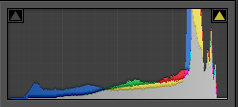
If you've any 'blown highlights' or catasrophically over-exposed pixels that are pure white and don't contain any detail, you'll see those peaking right up against the right-hand side. These are sometimes called 'clipped highlights'. You can expect to see some if you've the sun in the frame, or specular reflections on water or metal, so don't think that they're always a bad thing!
And contrast?
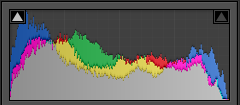
Histograms also indicate the contrast found in a scene, too. A narrow peak will mean a lower contrast image; a broader peak is indicative of an image with high contrast.
Where to find a histogram
All dSLRs and EVIL cameras will have a histogram included in their menu functions; higher end compacts often have them, too. On my Canon it's just a case of viewing an image in playback and then hitting the Info button twice.
When you're editing, the histogram is usually in the top right corner of your screen, but it will depend on your programme, obviously.
TL;DR
- A histogram is a graph displaying the distributon in brightness of an image's pixels
- There's no 'perfect' histogram; they're tools to help you assess exposure and contrast in an image
- Darker images will have histograms with data concentrated towards the left hand side of the graph
- Brighter images will have histograms with data concentrated towards the graph's right hand side
- High contrast images will have broad peaks in their histograms; low contrast images will have narrower peak
Golden hour << Photography Fundamentals >> ISO